Where would the Top 6 hopefuls be in the table if games played out like xG?
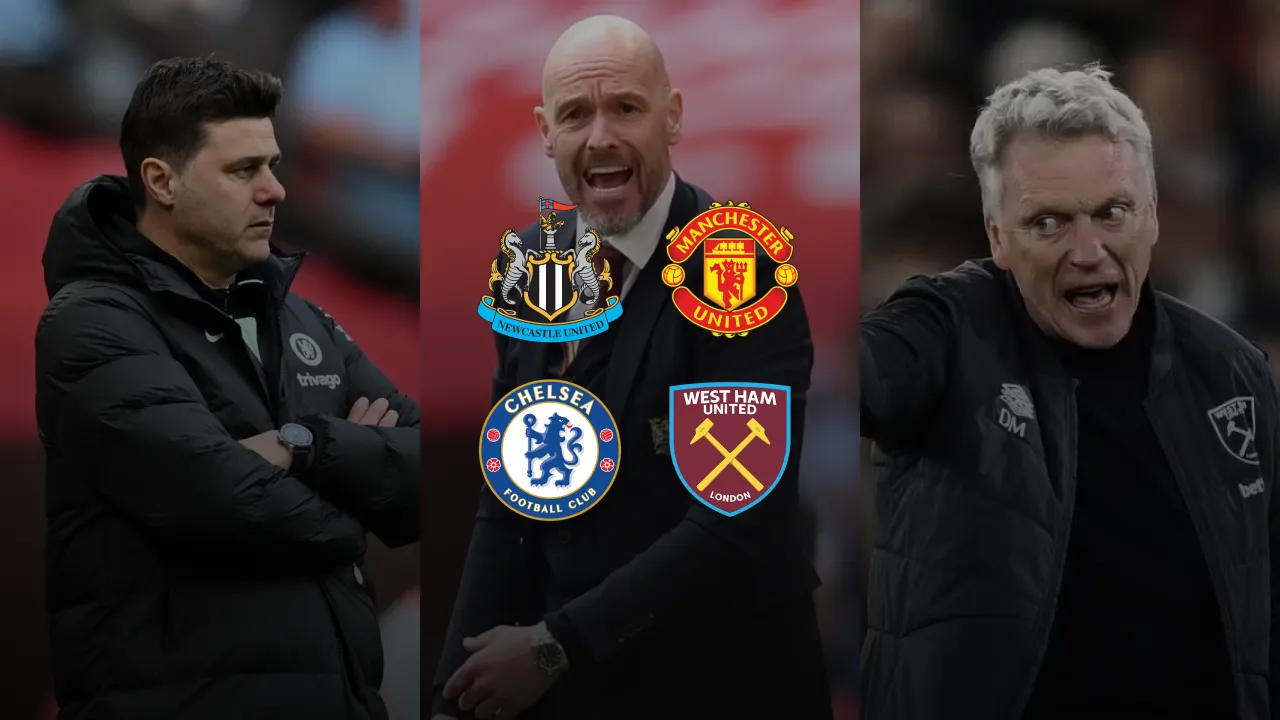
We love football for its unpredictability. Your opponents could have all the possession… all the momentum… all the opportunities to score… but if you’re the only team to take your chance, you can win a match against all the odds…
It’s the romanticism of the classic David and Goliath clash… FA Cup underdog fairytale stuff… unless you’re on the receiving end of all those outliers; as Chelsea boss Mauricio Pochettino claimed recently to much media hysteria and derision. He believes based on ‘data’… his team should be in the top 4 reckoning.
It’s completely the opposite with Erik Ten Hag’s Manchester United; who seem allergic to playing progressive football, or having any style of play at all. And yet, they’re still in the hunt for European football with a series of undeserved results that can at best be described as ‘flukey’.
Of course, football is subjective. And that’s what makes it brilliant… controversial… and so enjoyable to debate. But anyone with a pair of eyes can see that Ten Hag is talking out his backside with his continuous insistence that his team ‘dominated the game’ week in, week out… yet they still limp away with uninspiring performances and their tail between their legs.
‘David and Goliath’ indeed… except the likes of Chelsea and Man United are anything but underdogs; with two of the most expensively assembled squads in football history. In fact, despite the new tag of ‘the richest club in the world’, Newcastle are still relative outsiders in the top 6 hunt when compared with the Red Devils and the infamously labelled ‘Billion-Pound Bottle-jobs’.
So, as we count down towards 38 Premier League games of a frankly chaotic season where Newcastle have beaten all the odds to sit among the European places with five games remaining, we’re going to compare them with their fellow top six hopefuls and see whether Pochettino and Ten Hag have a point about the fortunes of their respective sides.
Obviously, we can argue with rival fans until the cows come home about who deserves to be where… but the most objective metric I can think of to measure ‘deserved’ results by is good old xG. So I’ll be making a mini league of where Newcastle and three hotly contesting top 6 rivals would be in the table if results had played out like each team’s xG.
For those not in the know, xG means ‘expected goals’ - so the amount of goals each team is expected to score based on the amount of clear-cut chances they have in the game. xG will be rounded to the nearest whole number, (for example, a team with an xG of 2.31 would be rounded down to 2 goals).
Take a look at each team’s xG results, and how that impacts their place in the table below…
*xG scores are rounded from Sofascore data and include fixtures up to 19/04/2024
Newcastle United
| Fixture | xG Result |
|---|---|
Aston Villa (H) | 3-2 (Win) |
Manchester City (A) | 0-1 (Loss) |
Liverpool (H) | 2-1 (Win) |
Brighton (A) | 1-1 (Draw) |
Brentford (H) | 1-1 (Draw) |
Sheffield United (A) | 4-1 (Win) |
Burnley (H) | 3-1 (Win) |
West Ham (A) | 2-1 (Win) |
Crystal Palace (H) | 2-1 (Win) |
Wolves (A) | 2-1 (Win) |
Arsenal (H) | 1-1 (Draw) |
Bournemouth (A) | 0-2 (Loss) |
Chelsea (H) | 2-1 (Win) |
Manchester United (H) | 3-0 (Win) |
Everton (A) | 2-3 (Loss) |
Tottenham Hotspur (A) | 2-4 (Loss) |
Fulham (H) | 4-0 (Win) |
Luton (A) | 1-1 (Draw) |
Nottingham Forest (H) | 2-3 (Loss) |
Liverpool (A) | 1-7 (Loss) |
Manchester City (H) | 1-3 (Loss) |
Aston Villa (A) | 3-1 (Win) |
Luton (H) | 2-2 (Draw) |
Nottingham Forest (A) | 0-2 (Loss) |
Bournemouth (H) | 2-2 (Draw) |
Arsenal (A) | 0-3 (Loss) |
Wolves (H) | 2-1 (Win) |
Chelsea (A) | 1-2 (Loss) |
West Ham (H) | 4-1 (Win) |
Everton (H) | 2-1 (Win) |
Fulham (A) | 1-1 (Draw) |
Tottenham Hotspur (H) | 3-1 (Win) |
Not a lot to comment on with our results, most played out as they should have done; with a few amusing exceptions…
Martin Dubravka had an exceptional game in our 4-2 loss at Anfield; a game we should have lost 7-1 according to xG, whereas the reverse game back at the start of the season should have been a 2-1 Newcastle win; but we didn’t need xG to tell us we should have won that game. That one still hurts…
The other big scoreline that grabbed my attention was Forest Away; a game we won 3-2 in actuality yet should have lost 2-0 in terms of xG. That shows just how good Bruno was that game and how he’s dragged us on his back at times during our injury woes.
Let’s see how it would look in terms of the table…
| P | W | D | L | GD | Pts | Pos. | |
|---|---|---|---|---|---|---|---|
Actual | 32 | 15 | 5 | 12 | 17 | 50 | 6th |
xG | 32 | 15 | 7 | 10 | 4 | 52 | 6th |
On the balance of things, not bad. Technically, we deserved a couple of extra draws over the course of the season but either way, we’d still be in 6th. If anything, it just reinforces how well Eddie and the boys have done in light of all the injuries and the Tonali scandal.
Manchester United
| Fixture | xG Result |
|---|---|
Wolves (H) | 2-2 (Draw) |
Tottenham Hotspur (A) | 2-2 (Draw) |
Nottingham Forest (H) | 3-1 (Win) |
Arsenal (A) | 1-2 (Loss) |
Brighton (H) | 1-2 (Loss) |
Burnley (A) | 1-1 (Draw) |
Crystal Palace (H) | 1-1 (Draw) |
Brentford (H) | 1-1 (Draw) |
Sheffield United (A) | 1-1 (Draw) |
Manchester City (H) | 1-4 (Loss) |
Fulham (A) | 1-1 (Draw) |
Luton (H) | 2-0 (Win) |
Everton (A) | 2-2 (Draw) |
Newcastle United (A) | 0-3 (Loss) |
Chelsea (H) | 4-2 (Win) |
Bournemouth (H) | 1-1 (Draw) |
Liverpool (A) | 1-2 (Loss) |
West Ham United (A) | 1-1 (Draw) |
Aston Villa (H) | 1-2 (Loss) |
Nottingham Forest (A) | 1-1 (Draw) |
Tottenham Hotspur (H) | 1-1 (Draw) |
Wolves (A) | 3-2 (Win) |
West Ham United (H) | 1-1 (Draw) |
Aston Villa (A) | 2-2 (Draw) |
Luton (A) | 3-2 (Win) |
Fulham (H) | 2-1 (Win) |
Manchester City (A) | 0-3 (Loss) |
Everton (H) | 3-2 (Win) |
Brentford (A) | 1-3 (Loss) |
Chelsea (A) | 1-3 (Loss) |
Liverpool (H) | 1-4 (Loss) |
Bournemouth (A) | 1-2 (Loss |
Where to start with this lot, eh? Look away Mister Ten Hag… it isn’t pretty reading. Just seven wins according to xG play, and only three of those are by a two-goal margin. Combine that with plenty of 1-1 draws… and it doesn’t exactly support the Dutchman’s claims of ‘dominating’ matches…
| P | W | D | L | GD | Pts | Pos. | |
|---|---|---|---|---|---|---|---|
Actual | 32 | 15 | 5 | 12 | -1 | 50 | 7th |
xG | 32 | 7 | 14 | 11 | -11 | 35 | 14th |
Of course, we acknowledge that xG should be taken with a pinch of salt. Newcastle beat Sheffield United 8-0 earlier in the season yet their xG was nearer half that. However, a blind man could see that Manchester United have flattered to deceive this season, and many of their narrow wins have been decided by an individual moment of brilliance as opposed to good team play and clear-cut chances. In fact, over half of their wins have been chalked off in our xG table, and while the Goals For tally is actually the same in both tables, their Goals Against tally takes a -11 hit; reinforcing the stats that Man United are amongst the leakiest in the league when it comes to conceding shots. But, in the context of fairness, that defensive lapse can be pointed in no small part to the fact that Manchester United’s defensive injury woes have been just as bad as ours.
It’s got to be said though, the only person who comes out of this experiment with any credit is Andre Onana… who thought we’d be saying that earlier in the season?
But most damning of all, 35 points at this stage would only be good enough for 14th in the actual Premier League table this season. For a team with the prestige and expectations of Manchester united, that’s appalling.
West Ham United
| Fixture | xG Result |
|---|---|
Bournemouth (A) | 1-1 (Draw) |
Chelsea (H) | 2-2 (Draw) |
Brighton (A) | 3-1 (Win) |
Luton (A) | 1-1 (Draw) |
Manchester City (H) | 1-4 (Loss) |
Liverpool (A) | 1-3 (Loss) |
Sheffield United (H) | 2-1 (Win) |
Newcastle United (H) | 1-2 (Loss) |
Aston Villa (A) | 1-2 (Loss) |
Everton (H) | 1-1 (Draw) |
Brentford (A) | 2-2 (Draw) |
Nottingham Forest (H) | 2-2 (Draw) |
Burnley (A) | 1-1 (Draw) |
Crystal Palace (H) | 1-1 (Draw) |
Tottenham Hotspur (A) | 2-2 (Draw) |
Fulham (A) | 1-2 (Loss) |
Wolves (H) | 1-1 (Draw) |
Manchester United (H) | 1-1 (Draw) |
Arsenal (A) | 1-3 (Loss) |
Brighton (H) | 1-2 (Loss) |
Sheffield United (A) | 2-3 (Loss) |
Bournemouth (H) | 1-1 (Draw) |
Manchester United (A) | 1-1 (Draw) |
Arsenal (H) | 0-4 (Loss) |
Nottingham Forest (A) | 1-3 (Loss) |
Brentford (H) | 2-1 (Win) |
Everton (A) | 2-3 (Loss) |
Burnley (H) | 2-1 (Win) |
Aston Villa (H) | 2-1 (Win) |
Newcastle United (A) | 1-4 (Loss) |
Tottenham Hotspur (H) | 1-1 (Draw) |
Wolves (A) | 1-1 (Draw) |
Fulham (H) | 1-3 (Loss) |
Vindication for the Moyes Out brigade here, these results don’t paint a pretty picture. Similar to Man United, plenty of drab 1-1 draws. And considering the array of attacking talent they have in the likes of Bowen, Paqueta, Ward-Prowse and Kudus… 44 xG Goals Scored is very disappointing, and perhaps highlighted that individual brilliance from the likes of Kudus and Bowen in particular are doing some serious heavy lifting for their under-fire manager.
| P | W | D | L | GD | Pts | Pos. | |
|---|---|---|---|---|---|---|---|
Actual | 33 | 13 | 9 | 11 | -6 | 48 | 8th |
xG | 33 | 5 | 15 | 13 | -14 | 30 | 15th |
Five xG-predicted wins. That’s one less than Luton Town in the actual league. Similar to Manchester United, the grim reality is that there is no coherent attacking strategy here, and 30 points from 33 games would traditionally be relegation form. This West Ham side is perhaps the biggest indication that possession, shots on target and clear-cut chances don’t necessarily win games… but it doesn’t mean West Ham fans can’t moan about it.
Chelsea
| Fixture | xG Result |
|---|---|
Liverpool (H) | 1-1 (Draw) |
West Ham United (A) | 2-2 (Draw) |
Luton (H) | 2-0 (Win) |
Nottingham Forest (H) | 2-1 (Win) |
Bournemouth (A) | 2-1 (Win) |
Aston Villa (H) | 1-1 (Draw) |
Fulham (A) | 2-1 (Win) |
Burnley (A) | 2-1 (Win) |
Arsenal (H) | 1-1 (Draw) |
Brentford (H) | 2-2 (Draw) |
Tottenham Hotspur (A) | 4-1 (Win) |
Manchester City (H) | 3-3 (Draw) |
Newcastle United (A) | 1-2 (Loss) |
Brighton (H) | 2-1 (Win) |
Manchester United (A) | 2-4 (Loss) |
Everton (A) | 1-1 (Draw) |
Sheffield United (H) | 3-0 (Win) |
Wolves (A) | 2-1 (Win) |
Crystal Palace (H) | 3-1 (Win) |
Luton (A) | 2-3 (Loss) |
Fulham (H) | 2-1 (Win) |
Liverpool (A) | 1-3 (Loss) |
Wolves (H) | 2-2 (Draw) |
Crystal Palace (A) | 1-1 (Draw) |
Manchester City (A) | 1-3 (Loss) |
Brentford (A) | 2-2 (Draw) |
Newcastle United (H) | 2-1 (Win) |
Burnley (H) | 4-2 (Win) |
Manchester United (H) | 3-1 (Win) |
Sheffield United (A) | 0-1 (Loss) |
Everton (H) | 3-1 (Win) |
It was Poch’s claim that his team deserved to be in the top 4 based on chance creation that got me wanting to write this article in the first place. And as much as I’ve enjoyed Chelsea continuing to stagnate this season, I must admit that the xG stats do point towards Chelsea deserving more than they’ve got.
The slow start seems to have cost them, according to xG, they deserved an extra seven points from their opening six games. Funnily enough, the first game they deserved to lose based on xG was actually against our Newcastle boys in November. An xG-predicted 3-2 loss to Luton also makes for interesting reading; they won that game 3-2 in actuality. They also deserved to go down 1-nil at Bramall Lane by xG metrics…
However, four out of five fixtures should have been wins in their most recent five, so it certainly points towards a Chelsea team that are growing with confidence. Newcastle and Man United may well have reason to be nervously checking over their shoulder…
| P | W | D | L | GD | Pts | Pos. | |
|---|---|---|---|---|---|---|---|
Actual | 31 | 13 | 8 | 10 | 9 | 47 | 9th |
xG | 31 | 15 | 10 | 6 | 15 | 55 | 6th |
As stated above, a recent resurgence has started to iron out some of the wrongs suffered early on in the season; but Chelsea have still lost four extra games than they should have according to xG. They should actually be above Newcastle when comparing their predicted points tally at this stage, and it’s also worth considering that they’ve played the least amount of games out of the four clubs featuring in this article. A very small disparity in terms of goals conceded perhaps hints at key games where a single goal proved crucial… such as the home losses to Forest and Villa at the start of the season.
Still, perhaps Pochettino wasn’t clutching at as many straws as we first believed, a little bit of vindication for the Argentinian and his claims?
Conclusion
Let’s look at our four highlighted teams in their own xG mini league…
| Pos. | Team | P | W | D | L | GD | Pts. |
|---|---|---|---|---|---|---|---|
1st | Chelsea | 31 | 15 | 10 | 6 | 15 | 55 |
2nd | Newcastle | 32 | 15 | 7 | 10 | 4 | 52 |
3rd | Man Utd | 32 | 7 | 14 | 11 | -10 | 35 |
4th | West Ham | 33 | 5 | 15 | 13 | -18 | 30 |
In the real table, just three points separate these four sides, and the top team here actually slips to the bottom of the quartet. But in this league, Chelsea and West Ham are actually a whopping 25 points apart.
As a Newcastle fan, it’s also slightly infuriating to see that we could’ve been 17 points clear of Man United at this stage, when we could in fact surrender 6th spot to them come the end of the season.
Ugh.
So next time a West Ham fan complains about David Moyes’ style of football, maybe cut them some slack?
But if you see a Man Utd fan claiming they should be higher than 7th right now, feel free to laugh out loud. I know I will next time I tune into an Erik Ten Hag press conference…
